| Season | Games | Season | Games |
|---|---|---|---|
| 2002 | 1,189 | 2015 | 1,230 |
| 2003 | 1,189 | 2016 | 1,230 |
| 2004 | 1,189 | 2017 | 1,229 |
| 2005 | 1,230 | 2018 | 1,229 |
| 2006 | 1,230 | 2019 | 1,230 |
| 2007 | 1,230 | 2020 | 1,059 |
| 2008 | 1,230 | 2021 | 1,080 |
| 2009 | 1,230 | 2022 | 1,230 |
| 2010 | 1,230 | 2023 | 1,230 |
| 2011 | 1,230 | 2024 | 1,231 |
| 2012 | 990 | 2025 | 1,231 |
| 2013 | 1,224 | 2026 | 1,231 |
| 2014 | 1,229 |
Leakage-Aware Modeling of NBA Game Outcomes Using Rolling Performance Metrics
Revised version
Abstract
I predict whether the home team wins an NBA regular-season game using only information available before tip-off: lagged rolling means of team box-score efficiency and pre-game Elo ratings. Models are trained on 2002–2025 and tested on the 2025–26 season, which no earlier version of this project used. A ridge logistic regression on rolling features plus Elo reaches 68.6% accuracy and an AUC of 0.738 on that season, against 55.4% for always picking the home team. A two-variable Elo model does almost as well (67.9%, AUC 0.731), and the 95% bootstrap interval for the AUC gain from adding rolling features includes zero. This revision also corrects three problems in the course version: cross-validation that mixed future and past seasons, a classification threshold tuned on the test season, and an incomplete data pull.
1 Introduction
Box-score statistics from a game describe that game. Using them to predict the same game’s result is leakage: the model sees information that would not exist at prediction time, and its accuracy looks better than it is (Kaufman et al. 2012). The same problem appears in evaluation when a model is validated on games that happened before the games it was trained on.
This project builds pre-game features from team box scores, checks in code that no feature uses the game it describes or any later game, and evaluates models in time order. It asks two questions:
- How much better than “the home team wins” can pre-game rolling efficiency metrics predict single-game outcomes?
- Do those metrics add anything beyond a simple Elo rating (Elo 1978)?
2 Data
Team box scores come from hoopR::load_nba_team_box() (Gilani 2021), which serves ESPN box scores compiled by the SportsDataverse project. I keep regular-season games between the 30 current franchises for the 2001–02 through 2025–26 seasons (labeled 2002–2026 by season end year). The snapshot used here was pulled on October 28, 2026.
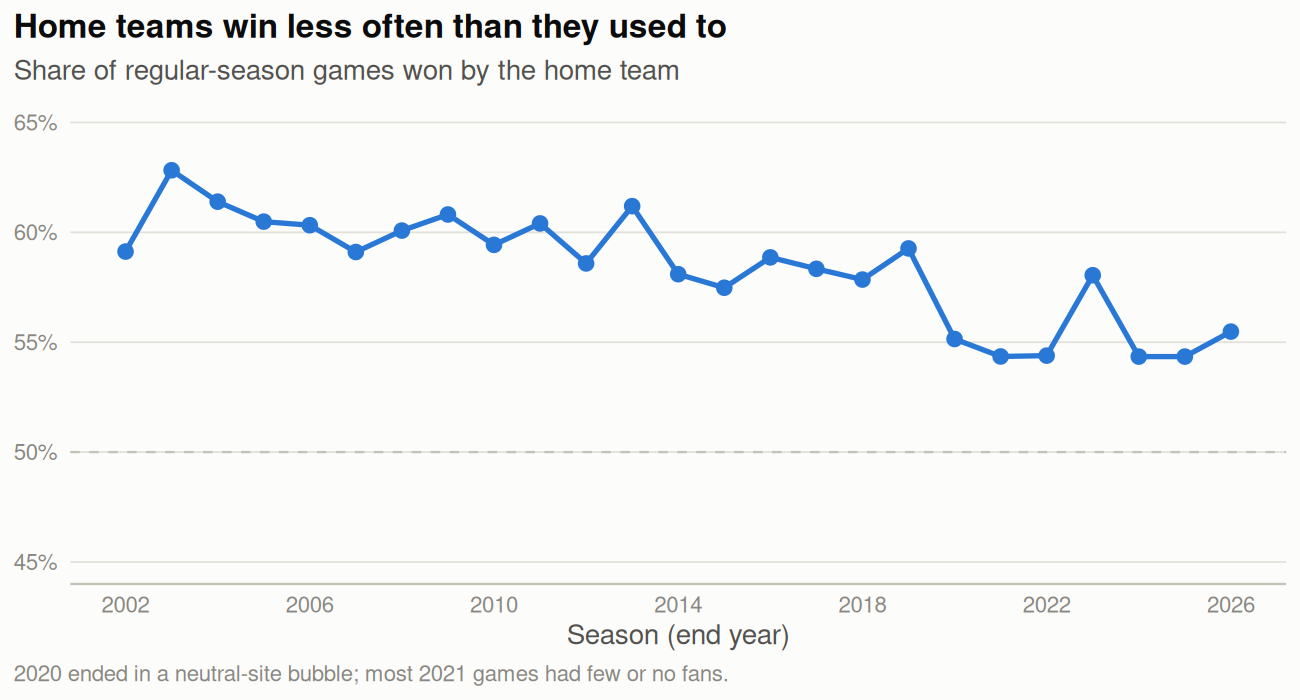
After dropping each team’s first game of every season (where no rolling history exists), 29,637 games remain. The home team won 58.5% of games from 2002 to 2025, but that share has fallen over time (Figure 1), which matters for any model trained on all past seasons.
3 Features
Per-game efficiency. For each team and game I compute possessions and the standard rate statistics (Oliver 2004; Kubatko et al. 2007): effective field-goal percentage, true shooting percentage, free-throw rate, three-point attempt rate, offensive and defensive rating, net rating, offensive and defensive rebound percentage, and turnover percentage.
Lagged rolling means. For a window of \(w \in \{3, 5, 10\}\) games, the feature for a team’s game \(t\) is the mean of that statistic over the team’s games \(t-w\) to \(t-1\) in the same season. The current game is never included, and windows reset at the start of each season, so the first game of a season has no value.
Matchup features. Each game gets the home and away team’s rolling values, plus home-minus-away differences and home/away ratios for rebounding and turnover rates.
Elo. Ratings start at 1500, use \(K = 20\) and a 100-point home advantage, and are updated after each game. The value attached to a game is the rating before that game. I keep two versions: one reset every season and one carried across seasons.
Checks. The test suite (tests/testthat/test-features.R) confirms that each rolling value equals the mean of the previous \(w\) games and that first games have no value. It also changes the result of one mid-season game and checks that no feature for that game, or any earlier game, changes, while later games do change.
4 Evaluation design
All evaluation is in time order (Hyndman and Athanasopoulos 2021).
- Validation (2015–2025). For each season \(s\), models are trained on all seasons before \(s\) and predict \(s\). This gives 11 out-of-sample seasons.
- Threshold. The cutoff for calling a home win is chosen to maximize accuracy on the last validation season (2025), then applied unchanged to the holdout.
- Holdout (2026). Models trained on 2002–2025 predict the 2025–26 season once (1,215 games).
- Penalty tuning. For ridge and elastic net (Friedman et al. 2010), the penalty is chosen by cross-validation inside the training seasons, with folds made of whole seasons.
- Metrics. Accuracy, AUC (Robin et al. 2011), Brier score (Brier 1950), and log loss. Holdout intervals come from 2,000 bootstrap resamples of games (Efron and Tibshirani 1993), including a paired interval for each model’s AUC minus the Elo-only model’s AUC.
The models are:
- Majority: always predict the training-set home-win rate.
- Logistic, Elo only: season-reset and all-time Elo differences.
- Logistic, lean rolling: five-game differences in net rating, offensive-minus-defensive rating, offensive rebound percentage, turnover percentage, and effective field-goal percentage.
- Ridge, rolling: all rolling features (3, 5, and 10 games), no Elo.
- Ridge, rolling + Elo, and elastic net, rolling + Elo (\(\alpha \in \{0.25, 0.5, 0.75\}\)).
- Gradient boosting (xgboost; 400 trees of depth 3, learning rate 0.03) and a neural net (one hidden layer of 8 units, weight decay 0.1, inputs standardized), both on rolling features + Elo. Their settings are fixed defaults, not tuned, so they are a check on whether a nonlinear model finds structure the linear models miss rather than a tuned comparison.
5 Results
5.1 Validation seasons
| Model | Accuracy | AUC | Brier | Log loss |
|---|---|---|---|---|
| Majority (home win rate) | 0.566 | – | 0.246 | 0.686 |
| Logistic: Elo only | 0.648 | 0.697 | 0.218 | 0.625 |
| Logistic: lean rolling | 0.615 | 0.645 | 0.231 | 0.654 |
| Ridge: rolling | 0.631 | 0.670 | 0.224 | 0.640 |
| Ridge: rolling + Elo | 0.652 | 0.699 | 0.216 | 0.621 |
| Elastic net: rolling + Elo | 0.651 | 0.700 | 0.216 | 0.620 |
| Gradient boosting: rolling + Elo | 0.649 | 0.698 | 0.217 | 0.623 |
| Neural net (MLP): rolling + Elo | 0.635 | 0.669 | 0.228 | 0.647 |
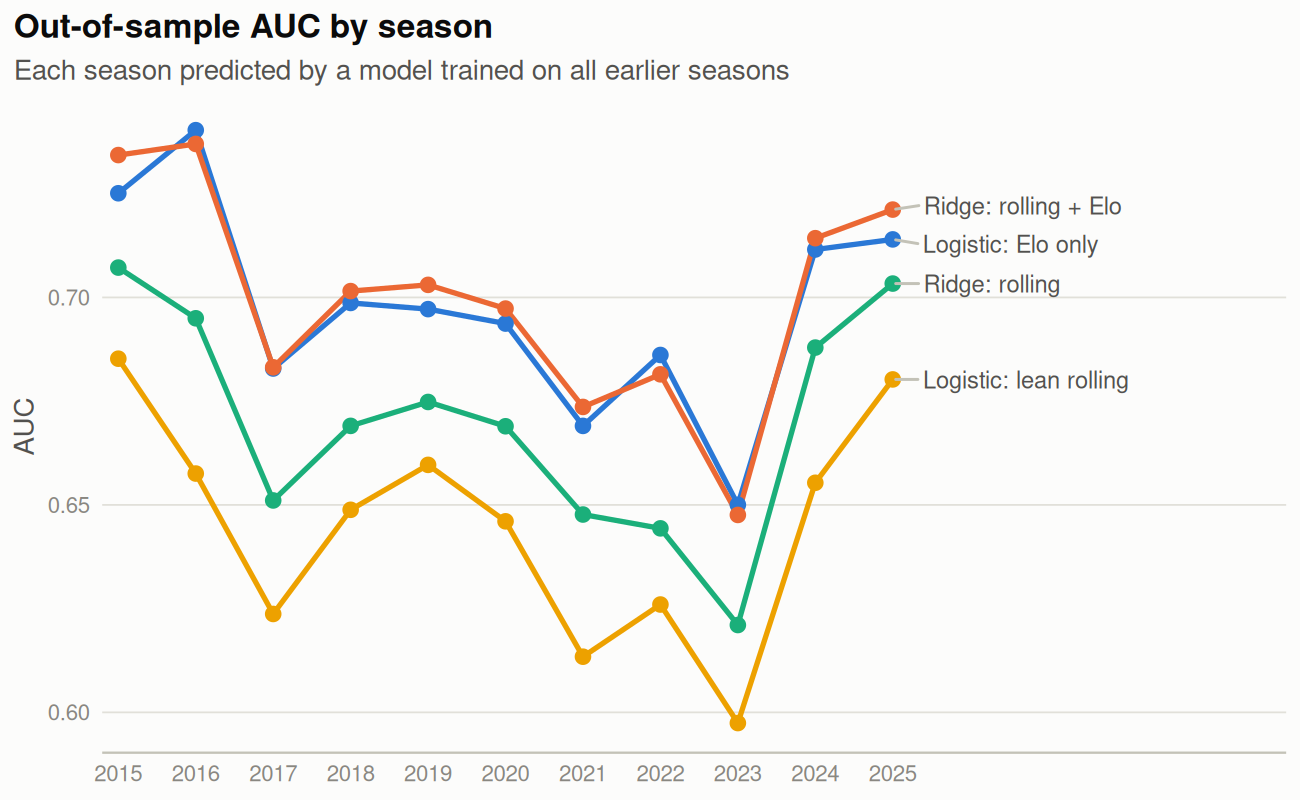
Across the validation seasons, ridge with rolling features and Elo averaged an AUC of 0.699. The Elo-only logistic model averaged 0.697, and rolling features without Elo averaged 0.670. Season by season (Figure 2), the full model had a higher AUC than Elo only in 8 of 11 seasons, and Elo only beat the rolling features without Elo in 11 of 11.
5.2 Holdout season (2025–26)
| Model | Acc. (0.5) | 95% CI | Acc. (val. thr.) | AUC | AUC 95% CI | Brier |
|---|---|---|---|---|---|---|
| Majority (home win rate) | 0.554 | 0.526–0.583 | 0.554 (0.50) | – | – | 0.248 |
| Logistic: Elo only | 0.679 | 0.651–0.706 | 0.681 (0.56) | 0.731 | 0.703–0.759 | 0.208 |
| Logistic: lean rolling | 0.642 | 0.615–0.670 | 0.647 (0.57) | 0.683 | 0.655–0.713 | 0.223 |
| Ridge: rolling | 0.664 | 0.638–0.691 | 0.659 (0.55) | 0.712 | 0.684–0.741 | 0.214 |
| Ridge: rolling + Elo | 0.686 | 0.662–0.712 | 0.686 (0.55) | 0.738 | 0.711–0.766 | 0.205 |
| Elastic net: rolling + Elo | 0.686 | 0.660–0.712 | 0.690 (0.54) | 0.737 | 0.709–0.765 | 0.205 |
| Gradient boosting: rolling + Elo | 0.682 | 0.656–0.709 | 0.679 (0.55) | 0.733 | 0.705–0.762 | 0.207 |
| Neural net (MLP): rolling + Elo | 0.653 | 0.627–0.679 | 0.653 (0.53) | 0.709 | 0.682–0.738 | 0.222 |
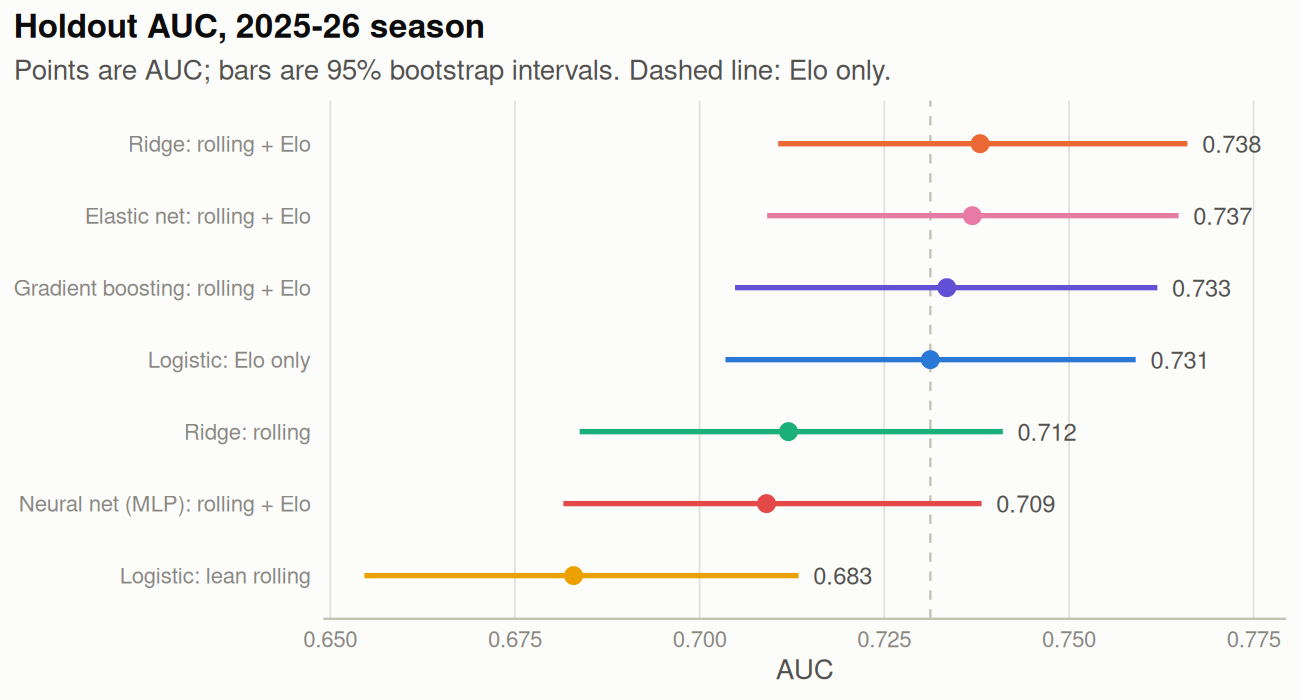
On the holdout (Figure 3), ridge with rolling features and Elo predicted 68.6% of games correctly (AUC 0.738), compared with 55.4% for always picking the home team. The Elo-only model reached 67.9% (AUC 0.731).
The paired bootstrap interval for the AUC gain of ridge with rolling features and Elo over Elo only is -0.002 to 0.015, which includes zero. For elastic net it is -0.001 to 0.012. Rolling features may add a small amount of discrimination, but this season cannot distinguish that from no gain.
The two nonlinear models did not improve on the linear ones. Gradient boosting reached an AUC of 0.733 on the holdout, close to Elo only, and the untuned neural net reached 0.709, below Elo only (paired interval -0.039 to -0.006). With 105 mostly correlated features and noisy outcomes, there may be little nonlinear structure to find, and the untuned neural net may overfit. Tuning both would need nested time-ordered validation, which I did not do.
Choosing the threshold on 2025 instead of using 0.5 changed holdout accuracy by at most 0.5 percentage points for any model.
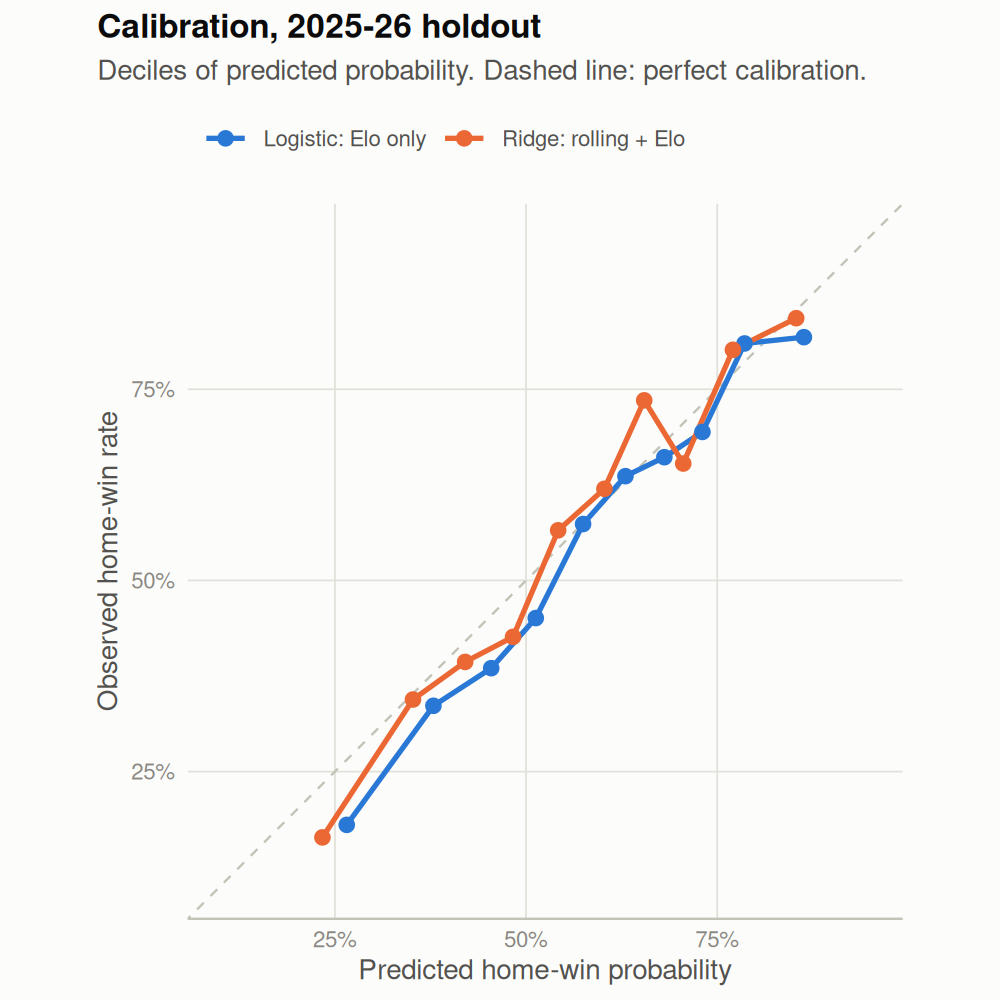
Both models over-predict home wins in the lower deciles of predicted probability (Figure 4). This fits a lower home-win rate in 2025–26 (55.4%) than in the training seasons (58.5%). Each decile holds about 120 games, so single bins are noisy.
5.3 Odds ratios
To describe associations rather than predict, I fit the lean logistic model on 2002–2025, with and without Elo. Rate differences are scaled so that odds ratios are per percentage point.
| Term | OR [95% CI] | p | OR [95% CI] | p |
|---|---|---|---|---|
| Net rating, 5 games | 1.0487 [1.0450, 1.0525] | <0.001 | 1.0138 [1.0098, 1.0178] | <0.001 |
| Home ORtg - away DRtg, 5 games | 1.0078 [1.0038, 1.0119] | <0.001 | 1.0078 [1.0037, 1.0120] | <0.001 |
| Off. rebound %, 5 games | 0.9934 [0.9887, 0.9982] | 0.007 | 0.9994 [0.9945, 1.0043] | 0.806 |
| Turnover %, 5 games | 0.9874 [0.9772, 0.9977] | 0.016 | 1.0052 [0.9945, 1.0160] | 0.344 |
| eFG%, 5 games | 1.0038 [0.9950, 1.0127] | 0.398 | 0.9983 [0.9892, 1.0074] | 0.710 |
| Elo, season reset | – | – | 1.0022 [1.0017, 1.0028] | <0.001 |
| Elo, all time | – | – | 1.0029 [1.0026, 1.0033] | <0.001 |
Without Elo, a one-point advantage in five-game net rating is associated with 4.9% higher odds of a home win. Holding net rating fixed, higher offensive rebound and turnover percentages are associated with slightly lower odds. This is expected rather than meaningful: net rating already reflects rebounding and turnovers, so these terms describe how a given net rating was produced, not separate effects. The effective field-goal term is not distinguishable from zero. Once Elo is added, the rate terms are all indistinguishable from zero, net rating’s odds ratio shrinks to 1.0138, and both Elo terms remain strongly associated with winning.
6 Changes from the course version
The original paper (January 2026, kept in reports/) was written for a course. Rerunning its code on its own data snapshot reproduces its numbers. I found the following problems, which this version corrects.
| Issue | Course version | This version |
|---|---|---|
| Cross-validation | Random 5-fold CV across 2002--2024; later seasons predicted earlier ones | Rolling-origin validation by season |
| Tuned threshold | Threshold tuned on the 2025 test season; reported 0.670 accuracy | Threshold chosen on the 2025 validation season and applied to 2026; it changed accuracy by under one point |
| Data completeness | Snapshot had 1,118 of 1,231 games in 2025 and 1,035 of 1,080 in 2021 | Fresh pull with full seasons |
| Elo | Described as not emphasized, but included in every penalized model and the inferential model | Elo reported as its own baseline; it carries most of the signal |
| Inferential model | Described as net rating, eFG%, and TOV%; text said shooting raised and turnovers lowered odds | Five terms plus a version with Elo; eFG% and TOV% effects were not significant in the course model |
| Data source | Cited as the NBA Stats API | hoopR / SportsDataverse (ESPN box scores) |
The course paper’s headline numbers were not badly off: its 2025 holdout accuracy for ridge (0.662, AUC 0.714) is close to what the corrected method gives on complete 2025 data (0.665, AUC 0.721). The problems were in what the evaluation could support: the tuned-threshold result was not a test-set result, and the conclusion that rolling efficiency metrics drive predictions did not account for Elo.
7 Limitations
- Only one holdout season. The 95% interval for single-season accuracy is about 5 percentage points wide.
- Home-court advantage has drifted down over time. Models trained on all past seasons over-predict home wins in a season like 2025–26.
- No rest, travel, injury, or roster information. Rolling team averages lag behind trades and injuries.
- Elo settings (\(K\), home advantage, reset rule) were not tuned.
- Data comes from a third-party package. A few early seasons are missing games relative to the official schedule (for example, 1,224 of 1,229 in 2013), and missing games shift rolling windows.
- Gradient boosting and the neural net use fixed settings and were not tuned.
8 Live evaluation (2026–27)
The 2025–26 holdout has now been looked at, so it can no longer serve as an untouched test for choosing among models. The 2026–27 season is used for that instead. Each morning a scheduled job updates the season’s data with the companion package NBAData, fits every model above on 2002–2026 with a fixed seed (so the models do not change during the season), and appends a probability for each of that day’s games to a log before tip-off. A team’s first game of the season has no rolling history, so those games use the Elo-only model. Results are scored as games finish and shown on the project site. They are not part of this paper’s results.
9 Reproducibility
The analysis is a targets pipeline (Landau 2021) with packages pinned by renv. From a fresh clone with R 4.6:
renv::restore()
targets::tar_make()
This rebuilds every table, figure, the project site, and this PDF (which needs a LaTeX installation with biber) from the saved data snapshot. Deleting the snapshot pulls fresh data through hoopR. The tests run with Rscript tests/testthat.R.
References
Brier, Glenn W. 1950. “Verification of Forecasts Expressed in Terms of Probability.” Monthly Weather Review 78 (1): 1–3.
Efron, Bradley, and Robert J. Tibshirani. 1993. An Introduction to the Bootstrap. Chapman & Hall.
Elo, Arpad E. 1978. The Rating of Chessplayers, Past and Present. Arco.
Friedman, Jerome, Trevor Hastie, and Robert Tibshirani. 2010. “Regularization Paths for Generalized Linear Models via Coordinate Descent.” Journal of Statistical Software 33 (1): 1–22. https://doi.org/10.18637/jss.v033.i01.
Gilani, Saiem. 2021. hoopR: Access Men’s Basketball Play by Play Data. https://CRAN.R-project.org/package=hoopR.
Hyndman, Rob J., and George Athanasopoulos. 2021. Forecasting: Principles and Practice. 3rd ed. OTexts. https://otexts.com/fpp3/.
Kaufman, Shachar, Saharon Rosset, Claudia Perlich, and Ori Stitelman. 2012. “Leakage in Data Mining: Formulation, Detection, and Avoidance.” ACM Transactions on Knowledge Discovery from Data 6 (4): 15:1–21. https://doi.org/10.1145/2382577.2382579.
Kubatko, Justin, Dean Oliver, Kevin Pelton, and Dan T. Rosenbaum. 2007. “A Starting Point for Analyzing Basketball Statistics.” Journal of Quantitative Analysis in Sports 3 (3). https://doi.org/10.2202/1559-0410.1070.
Landau, William Michael. 2021. “The Targets R Package: A Dynamic Make-Like Function-Oriented Pipeline Toolkit for Reproducibility and High-Performance Computing.” Journal of Open Source Software 6 (57): 2959. https://doi.org/10.21105/joss.02959.
Oliver, Dean. 2004. Basketball on Paper: Rules and Tools for Performance Analysis. Potomac Books.
Robin, Xavier, Natacha Turck, Alexandre Hainard, et al. 2011. “pROC: An Open-Source Package for R and S+ to Analyze and Compare ROC Curves.” BMC Bioinformatics 12: 77. https://doi.org/10.1186/1471-2105-12-77.