| Model | Games | Accuracy | Brier |
|---|---|---|---|
| Gradient boosting: rolling + Elo | 170 | 71.2% | 0.201 |
| Elastic net: rolling + Elo | 170 | 70.6% | 0.200 |
| Ridge: rolling + Elo | 170 | 70.0% | 0.202 |
| Logistic: Elo only | 170 | 65.9% | 0.208 |
| Neural net (MLP): rolling + Elo | 170 | 65.3% | 0.218 |
| Ridge: rolling | 170 | 64.1% | 0.224 |
| Logistic: lean rolling | 170 | 63.5% | 0.228 |
| Majority (home win rate) | 170 | 50.6% | 0.256 |
Live 2026-27 season
Every morning a scheduled job updates the season’s data, fits the frozen models (trained on 2001-02 through 2025-26), and logs a home-win probability for each of the day’s games before tip-off. The log is append-only and is committed by the scheduled job, so the repository’s history and the job’s run logs record when each prediction was added. Once games are final, they are scored here.
A team’s first game of the season has no rolling history, so those games are predicted with the Elo-only model for every model and marked as fallbacks.
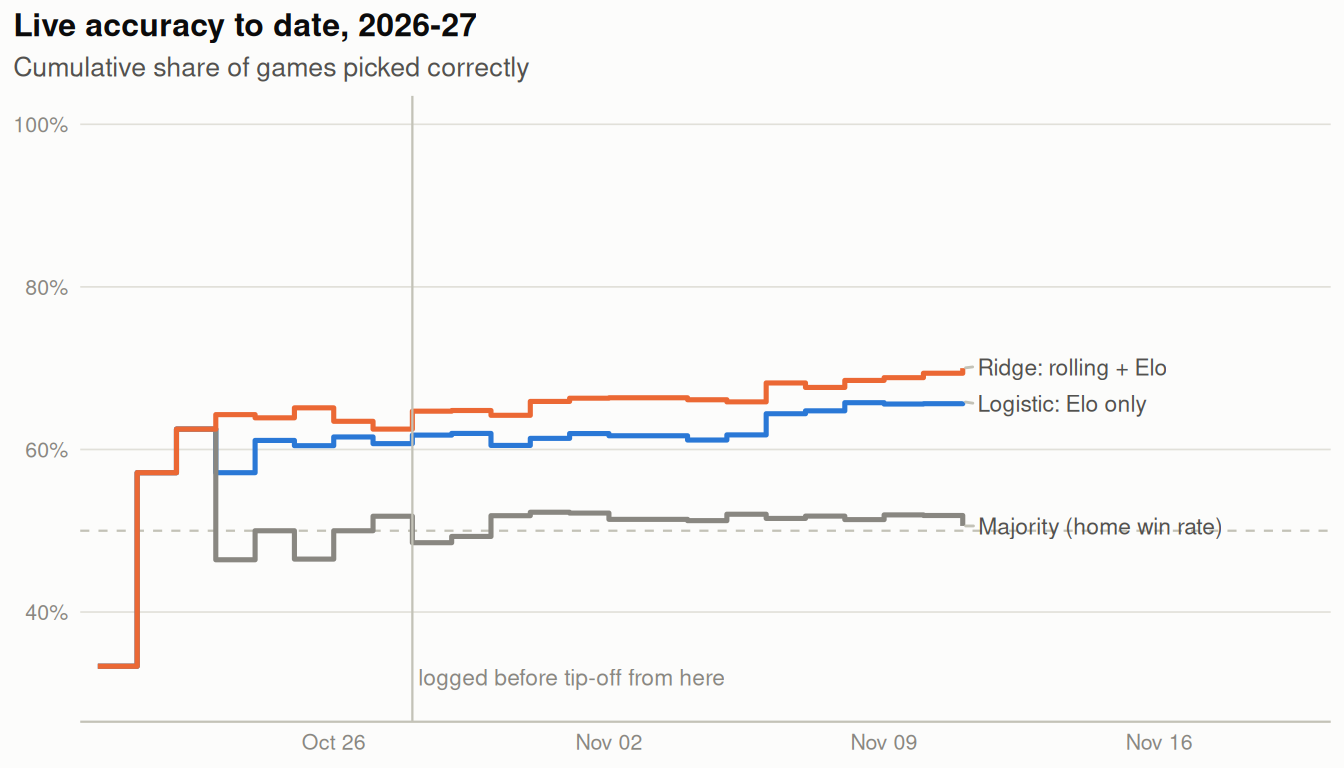
Backfilled games. Logging started on October 28, 2026. Games played before that were predicted afterwards and are labeled backfill in the log. They were predicted the same way: features use only games before each game’s date, and the models never saw any 2026-27 data. A test checks that a backfilled prediction equals the one made from data cut off before that day. They are still not a pre-game record, so the tables show them separately.
Last prediction logged: 2026-11-12 21:47:09 (UTC).
Accuracy to date
170 games scored: 57 backfilled, 113 logged before tip-off. With this few games, accuracy can move by about 8 percentage points either way.
Pre-game predictions only
| Model | Games | Accuracy | Brier |
|---|---|---|---|
| Elastic net: rolling + Elo | 113 | 73.5% | 0.198 |
| Gradient boosting: rolling + Elo | 113 | 73.5% | 0.197 |
| Ridge: rolling + Elo | 113 | 73.5% | 0.199 |
| Logistic: Elo only | 113 | 68.1% | 0.204 |
| Neural net (MLP): rolling + Elo | 113 | 68.1% | 0.216 |
| Logistic: lean rolling | 113 | 66.4% | 0.224 |
| Ridge: rolling | 113 | 66.4% | 0.215 |
| Majority (home win rate) | 113 | 50.4% | 0.256 |
Latest predictions
| Game | Ridge + Elo: P(home win) | Elo only | Pick | Fallback |
|---|---|---|---|---|
| DAL at MIN | 72% | 75% | MIN | |
| TOR at PHI | 65% | 68% | PHI | |
| CHA at PHX | 54% | 61% | PHX | |
| DET at WSH | 22% | 26% | DET |
The full log, with every model’s probability, is live/predictions_2027.csv.