| Model | Accuracy | Accuracy 95% CI | AUC | Brier |
|---|---|---|---|---|
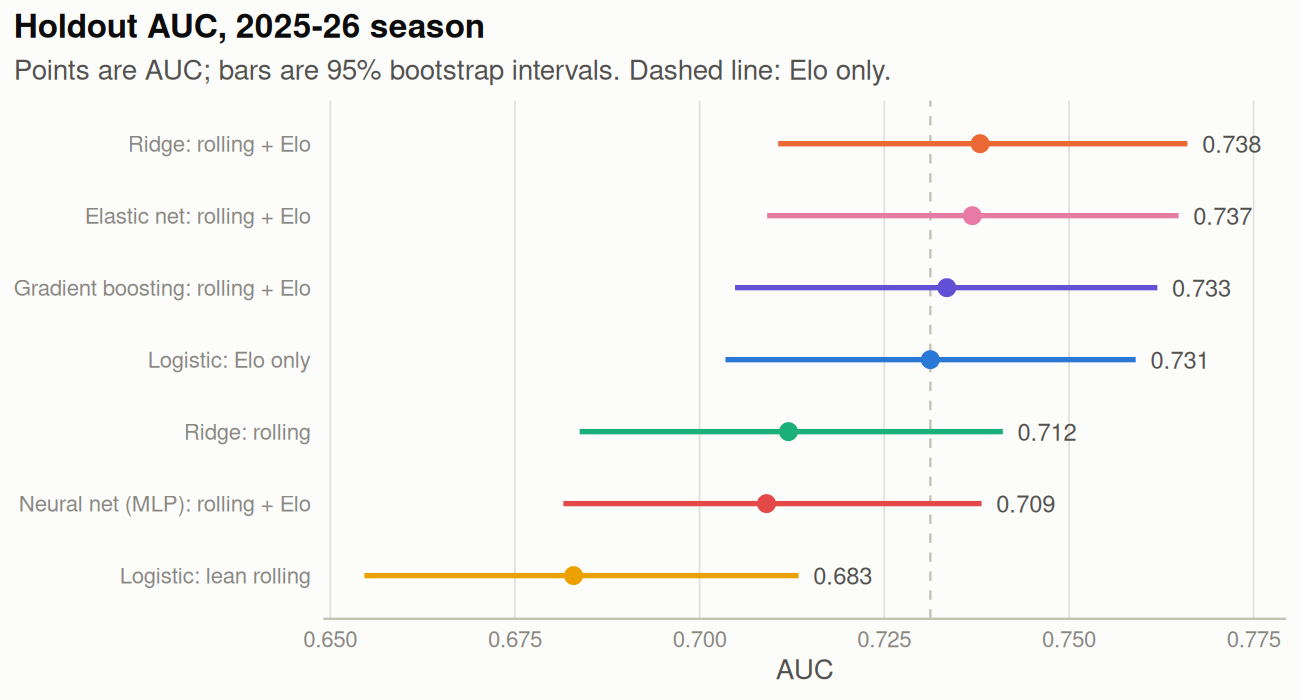
| Ridge: rolling + Elo | 0.686 | 0.662-0.712 | 0.738 | 0.205 |
| Elastic net: rolling + Elo | 0.686 | 0.660-0.712 | 0.737 | 0.205 |
| Gradient boosting: rolling + Elo | 0.682 | 0.656-0.709 | 0.733 | 0.207 |
| Logistic: Elo only | 0.679 | 0.651-0.706 | 0.731 | 0.208 |
| Ridge: rolling | 0.664 | 0.638-0.691 | 0.712 | 0.214 |
| Neural net (MLP): rolling + Elo | 0.653 | 0.627-0.679 | 0.709 | 0.222 |
| Logistic: lean rolling | 0.642 | 0.615-0.670 | 0.683 | 0.223 |
| Majority (home win rate) | 0.554 | 0.526-0.583 | - | 0.248 |
Predicting NBA home wins without leaking the future
Rolling team efficiency and Elo, evaluated in time order
This project predicts whether the home team wins an NBA regular-season game, using only information available before tip-off. Models are trained on 2001-02 through 2024-25 and tested once on the 2025-26 season (1,215 games). Predictions for the current season are logged daily before each game; see Live 2026-27.
68.6%
Holdout accuracy, ridge with rolling features + Elo
67.9%
Elo ratings alone
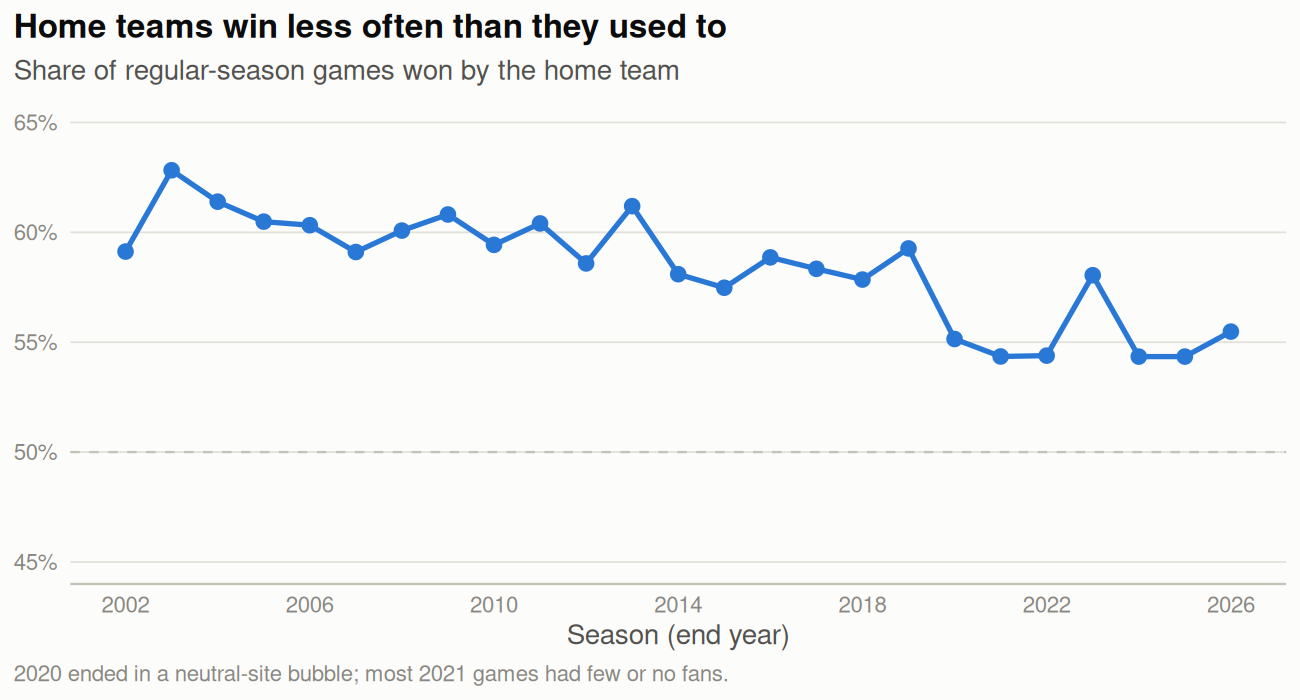
55.4%
Always picking the home team
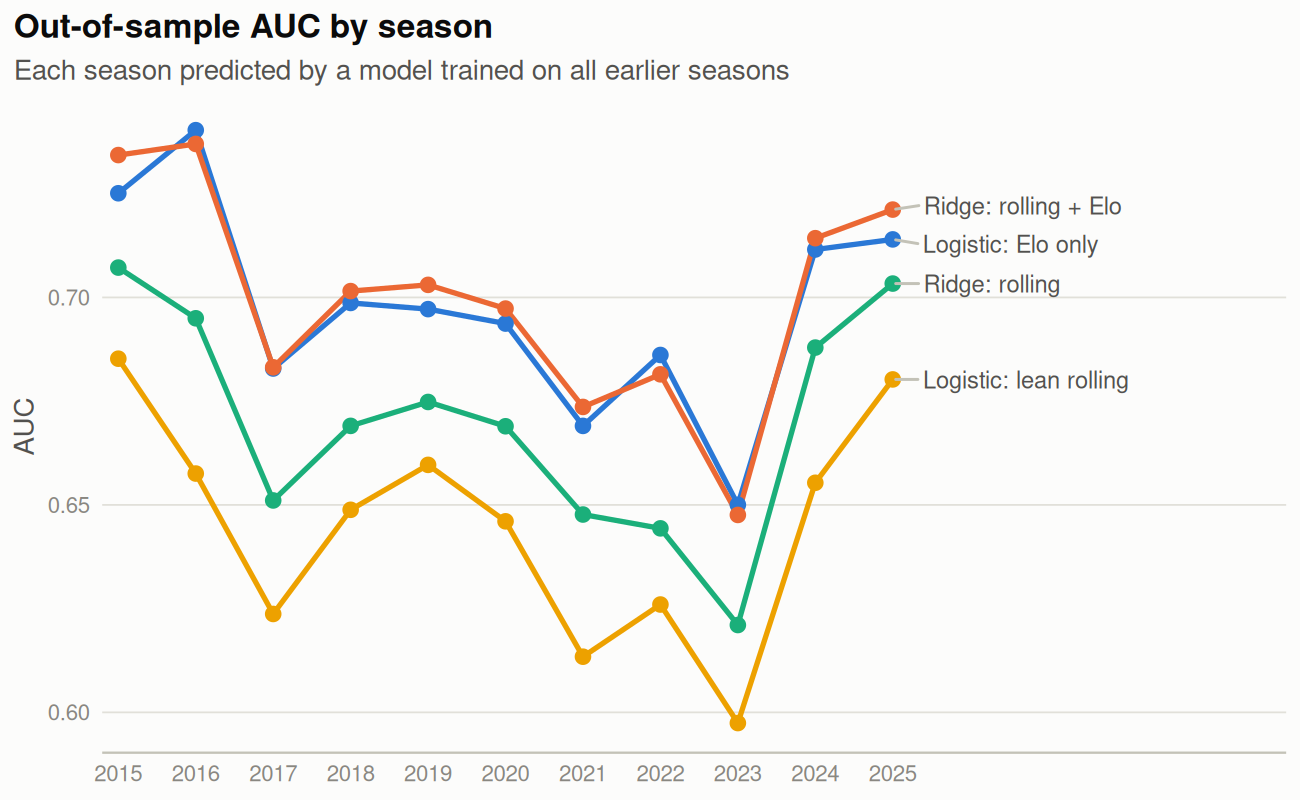
The full model beats always picking the home team by a wide margin, but Elo ratings alone get most of the way there. The 95% bootstrap interval for the AUC gain from adding rolling features to Elo is -0.002 to 0.015, which includes zero.
All models on the holdout
Code and data pipeline: nba-modeling and nba-data.